
How to freeze columns in a matrix/table in Power BI?
I received this requirement multiple times from the client because this feature can be easily achievable in Excel and most of the clients are used to it. Then I decided to write an article so that it can be beneficial for other Power BI Developers as well.
So In this article, we will get the solution for freezing a few columns in a table while scrolling other columns/measures in a table. This is extremely useful when there are a large number of columns to show in a table but there are a few dimension column that we always want to show in a table and does not want to disappear due to the scroll in the table.
The same feature is available in excel for a very long time and it is used very widely by users. Now let`s see the steps for getting the solution for the freezing columns in the table.
Step1: Use Matrix Visual
You will need to use a matrix visual for freezing a few columns in the table so that they are always visible while scrolling the table.

Step 2: Add Dimension Column in the Row Field and Measures in the Value Field in the Visualization Pane
Now add the Dimension columns and measures columns in the Rows and Value field in the Visualization Pane. You will be able to see the columns in the Matrix Visual we have added in the previous steps.

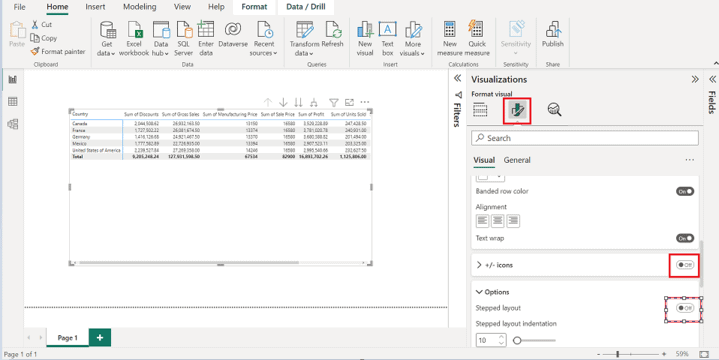
Step 3: Disable +/- icons and Stepped Layout option in the Visualization Pane
Go to the Format Visual tab in the visualization pane and disable the +/- icons option and stepped layout option in the Row Header sub tab.
Step 4: Click on the Drilldown button
Click on the drill-down button available at the top of Matrix Visual multiple times equal to the number of dimension columns. Now you will be able to see the dimension column froze when you try to scroll the matrix visual.

Conclusion
With these four steps mentioned above you can easily freeze the columns in a table in Power BI using matrix visual but visual presentation is just like a table. If you want to add a column header that option is still available to the developer.
I hope this article will help some of the Power BI Developers who are searching for a solution to create a freeze pane in a table.


Ok so what if you don’t have any value fields in your table report – changing it to a matrix report to freeze panes does not work – any suggestions?