

Why Microsoft Power BI so Slow?
Most of the developers working on Microsoft Power BI face issues in two ways. First, the Microsoft Power BI Application installed on the machine is not working properly and the developer is facing problems in performing any task. Second, the issue is related to report optimization. Generally, it is the responsibility of the developer to make an optimized report so that report loads quickly and also report refresh time is quite less.
Here, in this article, we will discuss the second issue that is report optimization. So, Why Microsoft Power BI is Slow? Microsoft Power BI is a tool that can consume a very large amount of data so it is very necessary to follow the steps of report optimization while developing the report. Using a lot of images, multiple visuals, improper DAX formula, consuming unnecessary columns into the data model, and not taking into consideration query folding are some of the reasons why Microsoft Power BI Report is slower.
Best Practices for Microsoft Power BI Report Optimization
It is very important to know about various steps of report optimization while developing a Microsoft Power BI Report for the end users/client. Optimizing your Power BI report makes the report load faster and also helps in loading data faster during refresh intervals.
Let`s see in this article Microsoft Power BI report optimization steps.
Step 1: Using Query Folding
According to Microsoft Docs, Query Folding is the ability of Power Query to generate a single query statement to retrieve and transform source data.
When Query folding takes place it helps to process and compute the transformation steps applied in power query on the database side which helps to improve the query performance. Mainly, it helps to load data faster while performing refresh operations.
During Incremental refresh as well, query folding help to perform efficient report operation and help in reducing the refresh duration.
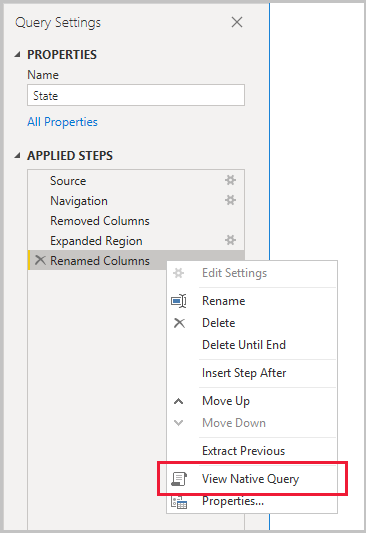
Some of the sources which support query folding are relational databases, OData Feed, Sharepoint List, Active directory, etc. It is very essential to know whether query folding is taking place for a particular query or not. If the native query option is enabled for a query then Query Folding is taking place if not enabled then Query Folding is not taking place. Please see the below screenshot for reference.
Step 2: Disable the Enable Load Option for a Query
Whenever a table is loaded in the form of a query in the Power Query then by default enable load option is active and that particular query is loaded into the data model. But there are certain tables that act as a supporting tables and are not required in the data model.
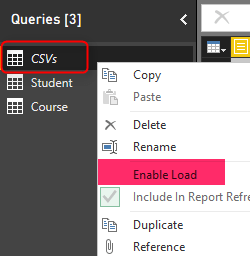
We can disable the Enable Load option for such supporting tables so that they do not load into the data model and increase its size since we know there is a data size limitation for free, pro licenses, and also in premium capacity.
Please find the below screenshot showing how to disable the enable load for a query (table).
Step 3: Use Power BI Dataflow instead of Power Query
It has been tested that using Power BI dataflow is better for applying transformation steps instead of Power Query.
The important thing to note here is that Power BI dataflow is available with Premium capacity. So if you are having Premium workspace then make sure to use Power BI dataflow to apply transformation steps for achieving better performance.
Step 4: Reduce the Number of Images used in the Report
In some of the reports, there is a requirement for using multiple images but as a developer, we should use a lesser number of images as using a lot of images in the report reduces the performance of the report and the report take a lot of time to render the image.
Also, you can convert the image to base 64 if the image file size is more. You will be facing difficulty in using images of larger data sizes so converting images to base64 is a good choice.
Step 5: Reduce the number of Visuals in the Report
For better performance of the Report, it is essential to reduce the total number of visuals on the page of the report. There are two options one is the use of a visual which can replace multiple visuals such as small multiple visuals in Power BI which is now generally available in the July 2021 update.
So, the main point is to explain to use a single visual instead of multiple visuals as multiple visuals take time to render while loading in Power BI Service.
Step 6: Use Star Schema for Better Performance
It has been proved practically that the best schema for preparing a data model on the Power BI side is Star Schema. Please check out Guy in a Cube video for more detail.
Step 7: Evaluate Custom Visual Performance
Sometimes we have to use Custom Visual in the report for meeting the expectation of the client which is not possible through standard visuals available in Power BI.
But there is a constraint that all custom visuals available in the marketplace are not optimized for best performance. Using such visuals can cause performance issues in the report.
So, it is essential to be cautious while using custom visuals in the report.
Step 8: Use Optimized DAX Formula
It is important to use the appropriate dax function while creating measures and calculated columns. For learning DAX, You can check Best Resources to learn DAX. To know about the steps for optimizing DAX, you can check DAX Best Practices.
Step 9: Limit Data Model
You can limit the data model by restricting unnecessary columns either at the database level or power query level.
Another method is to use row level security which will restrict rows based on the filter condition set in the rule while setting up the row level security. One more method of limiting the data model in power bi is to disable the enable load in the power query. This method I have explained in Step 2.
Step 10: Use Measure instead of Calculated Column
Measures are calculated on the runtime while calculated columns consume memory for processing information so it is best practice to create measures instead of the calculated columns.
Step 11: Use Variable instead of Measures
If there is any formula that is not required to be used in any other measure then it is suggested to use a variable as it helps keep the code clean and also makes the code structured.